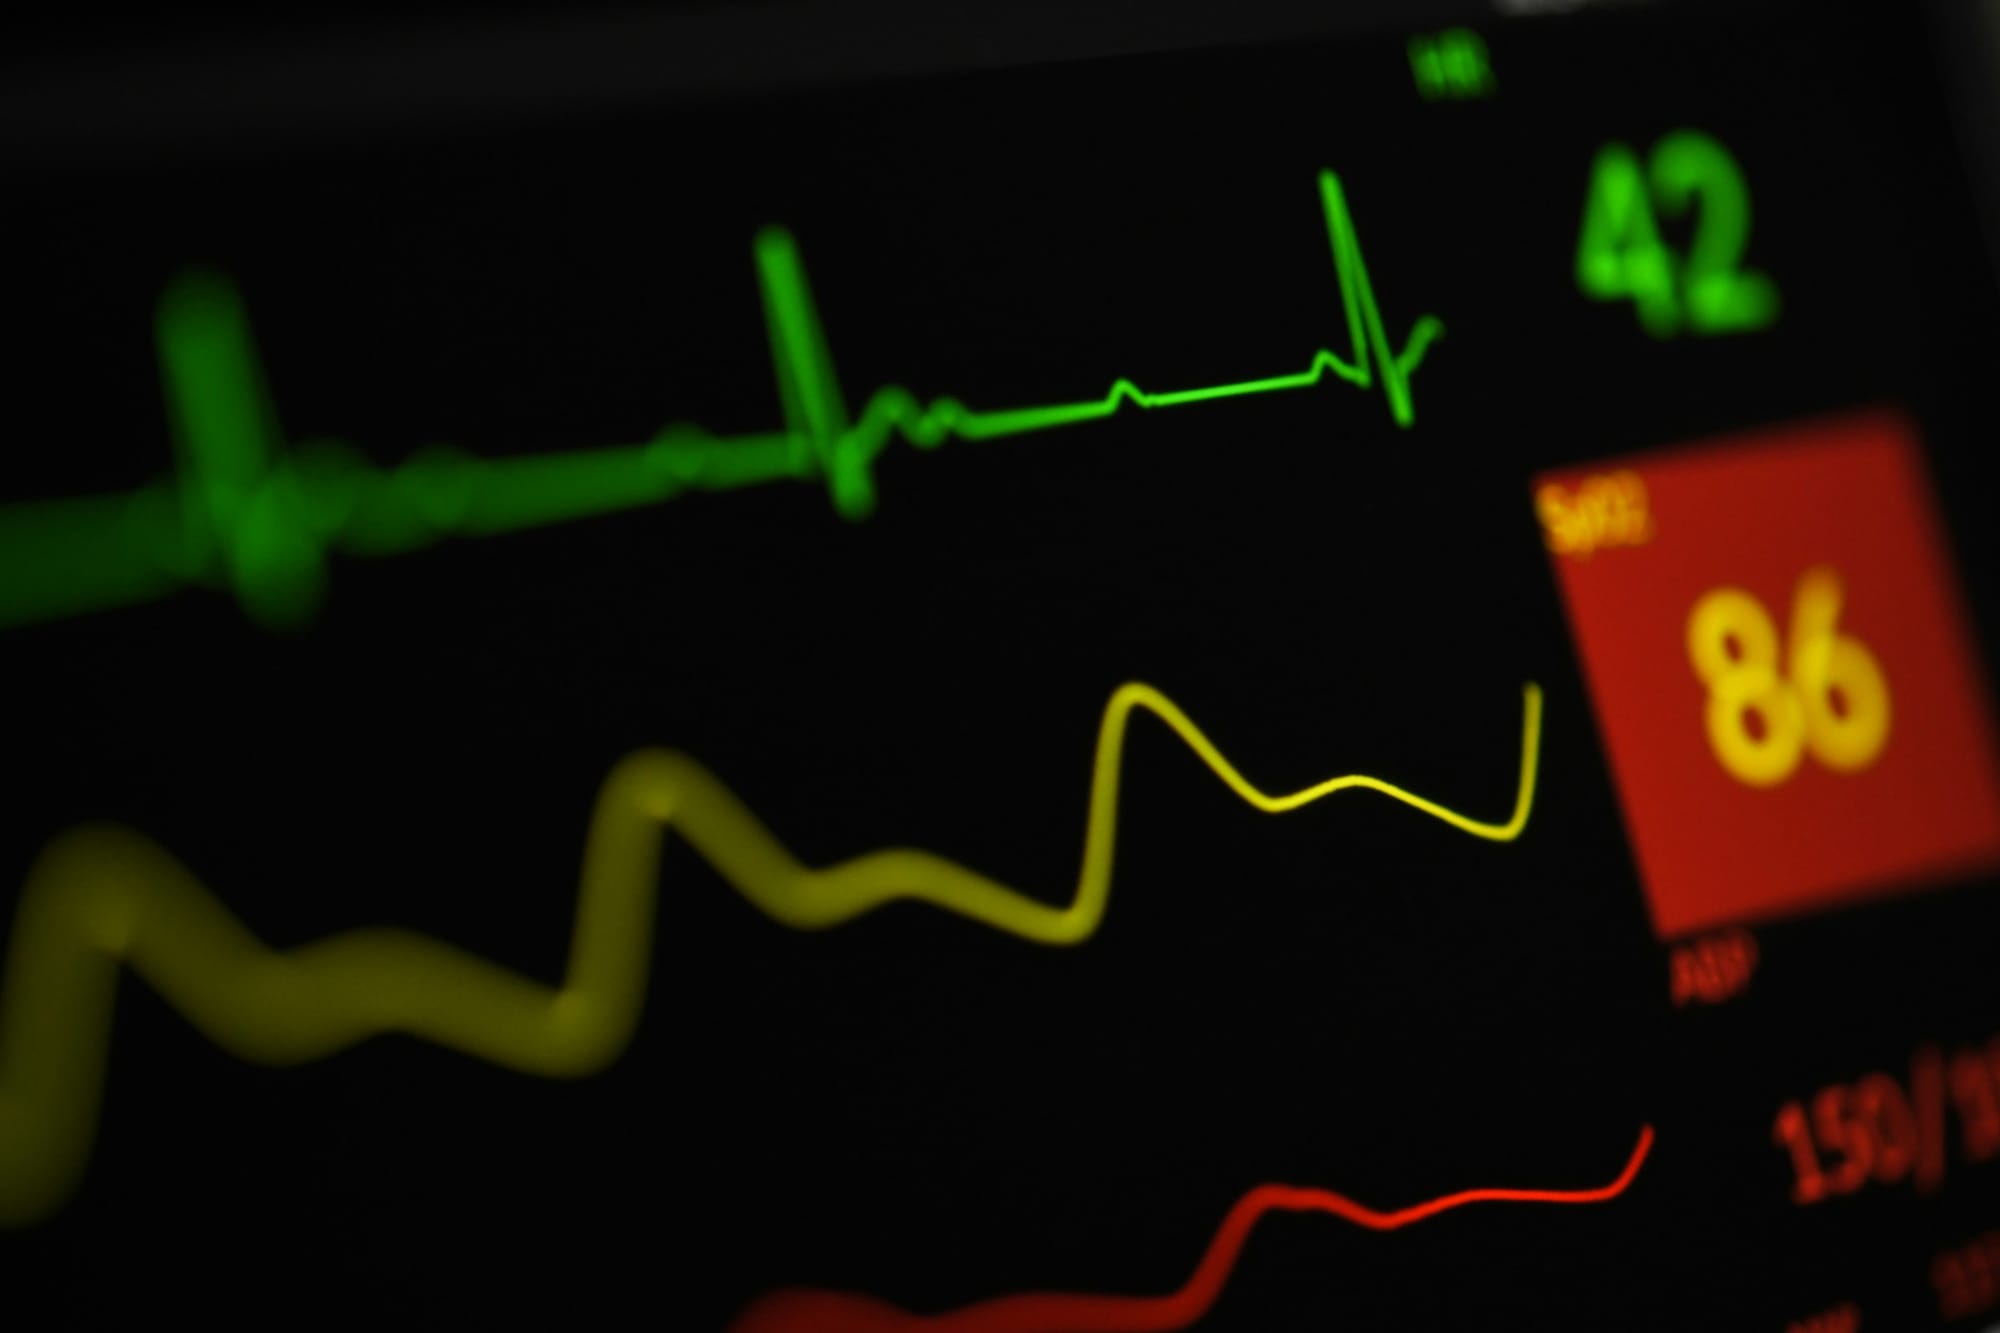
Remote Patient Monitoring (RPM) has emerged as a cornerstone of modern chronic disease management and post-acute care. Continuous physiologic data streams promise earlier detection of clinical deterioration, reduced readmissions, and improved patient outcomes. Yet the operational reality of RPM programs reveals a paradox: the very technology designed to prevent adverse events has introduced a new category of clinical risk — alert fatigue.
Alert fatigue describes the progressive desensitization of clinical staff to electronic alarm signals resulting from their high frequency, low specificity, and frequent false positives. When clinicians are bombarded with hundreds of alerts per patient per day, the signal-to-noise ratio collapses. Clinicians override alerts reflexively. Critical deterioration events go unacknowledged. Patients are harmed.
This white paper synthesizes the peer-reviewed evidence on alert fatigue in ICU and RPM contexts, quantifies its clinical and operational burden, and introduces the Exception-Based Model — a structured redesign of alert architecture that replaces threshold-based sirens with trajectory-tracking intelligence, adaptive personalization, and machine learning prioritization.
Key Findings
- 88.8% of arrhythmia alarms in ICU settings are false positives, generating 187 audible alarms per bed per day
- r = −0.381 (P = 0.001): the correlation between nurse alarm fatigue and medical error
- 88.8% of arrhythmia alarms are false positives; ML-based alert prioritisation has cut daily alert rates by 21.2% in early real-world analyses (as an aspirational target, false-positive rates below 15% have not yet been demonstrated in prospective RPM deployments)
- Predictive lead time remains an aspiration: no prospective RPM deployment has yet demonstrated a validated, reproducible predictive lead time for clinical events
- In a nonrandomized clustered pragmatic trial, real-time ML alerts did not reduce escalation of care (the pre-specified primary outcome) but were associated with lower combined in-hospital and 30-day mortality (7.0% vs 9.3%; RR 0.76, 95% CI 0.58–0.99, p = 0.045) — a secondary endpoint, in a trial stopped early during COVID-19
- A time-to-escalation signal of −5.70 h appeared in the preprint of that trial and was not reported as a primary finding in the peer-reviewed report
Pathophysiology and Clinical Gap: Why Alarm Fatigue Destroys Clinical Signal
The Neurobiology of Desensitization
Alert fatigue is not merely an operational inconvenience. It is a measurable form of neurocognitive overload with a defined pathophysiology. When clinicians are exposed to high-frequency, repetitive auditory stimuli, the leading mechanistic hypothesis is that repeated exposure to high-frequency, low-specificity alarms attenuates perceived salience (the “law of habituation”).1 This process — sometimes termed the “law of habituation” — is an evolutionary adaptation that allows organisms to filter irrelevant environmental stimuli. In the clinical environment, this biologic response becomes a patient safety liability.
The chronic stress response further compounds this effect. Persistent alarm exposure is associated with increased stress and cognitive load, although cortical and neuroendocrine effects have not been directly measured in the cited clinical studies responsible for executive decision-making, risk assessment, and working memory.5,6 Clinicians experiencing high alarm loads do not consciously choose to ignore alerts; their neurobiologic response to the environment has been altered by the environment itself.
The Scale of the Problem in Continuous Monitoring
The quantitative scope of alarm generation in critical care settings is staggering and well documented. A cross-sectional study of 17,442 patient encounters recording over 65.6 million alarms found that 88% of all alarms were technical alarms, and 68% of audible alarms arose from technical issues — not actionable clinical events.7 Bedside monitors in ICU environments generate between 5 and 10 audible alarms per patient per hour, of which 54–67% are attributable to technical artifact rather than physiologic change requiring clinical action.7
In the landmark Drew et al. study of 461 ICU patients over 31 days, 2,558,760 total alarms were recorded. Of 12,671 annotated arrhythmia alarms, 88.8% were false positives — meaning the arrhythmia detected by the monitor did not correspond to a true clinical arrhythmia on independent electrocardiographic review.1 At 187 audible alarms per bed per day, the cognitive burden placed on nursing staff is not an abstraction; it is a measurable obstacle to safe patient care.
Why Threshold Alerts Systematically Fail
Conventional RPM alert systems operate on threshold logic: a vital sign is compared against a fixed cutoff value, and an alert is triggered when the value exceeds that threshold. This architecture fails for three structural reasons:
Static thresholds cannot accommodate physiologic variability. Human physiology is dynamic. A heart rate of 110 bpm may be entirely appropriate for a patient with sepsis or postoperative pain; a threshold set at 100 bpm generates a false alert. Conversely, a patient’s condition may deteriorate with a trajectory toward a threshold the patient will never actually cross at the time of clinical crisis.
Thresholds ignore rate of change. A patient whose heart rate rises from 72 to 98 bpm over 20 minutes is exhibiting a more concerning clinical trajectory than a patient whose rate is chronically 95 bpm. Threshold alerts are blind to velocity and acceleration of physiologic change.
Thresholds produce categorical binary signals without clinical context. The question “Is this heart rate above 100?” is clinically meaningless without knowing the patient’s diagnosis, medications, baseline function, and recent trend. Threshold alerts strip away every variable that makes clinical judgment accurate.
Quantitative Evidence Matrix
The following table presents the verified evidence base supporting alert fatigue burden quantification and the efficacy of machine learning-enhanced alert systems. PMIDs and DOIs are provided for audit. Citations were verified against publisher records at the time of writing; where the clinical evidence is preliminary (preprint status, nonrandomized design, or exploratory endpoints), the text states this.
| Study | PMID / DOI | Design | Metric | Value | P-value |
|---|---|---|---|---|---|
| Drew BJ et al. (2014), PLOS ONE1 | PMID 25338067 | Prospective; 461 ICU pts, 31 days | False positive rate (arrhythmia) | 88.8% | NR |
| Drew BJ et al. (2014), PLOS ONE1 | PMID 25338067 | Prospective; 461 ICU pts, 31 days | Audible alarms/bed/day | 187 | NR |
| Drew BJ et al. (2014), PLOS ONE1 | PMID 25338067 | Prospective; 461 ICU pts, 31 days | Total alarms recorded | 2,558,760 | NR |
| Kraevsky K et al. (2026), Scientific Reports7 | PMID 41851183 | Cross-sectional; 17,442 encounters | Technical (non-actionable) alarms | 88% | NR |
| Kraevsky K et al. (2026), Scientific Reports7 | PMID 41851183 | Cross-sectional; 17,442 encounters | ICU audible alarms/patient/hour | 5–10 | NR |
| Gülşen M & Arslan S (2025), Healthcare5 | PMID 40150480 | Correlational; n=201 surgical ICU nurses | Alarm fatigue ↔ medical error correlation | r = −0.381 | P = 0.001 |
| BMC Nursing (2026)6 | PMC13041063 | Correlational; n=103 nurses | Digital alert fatigue ↔ escalation | r = −0.41 | P < 0.001 |
| BMC Nursing (2026)6 | PMC13041063 | Correlational; n=103 nurses | Median alert fatigue score | 3.4 (IQR 3.0–3.8) | — |
| Boulitsakis Logothetis S et al. (2023), Scientific Reports3 | PMID 37604974 | Retrospective comparative; 118,886 unplanned admissions | Daily alert rate reduction (LightGBM vs NEWS2) | −21.165% | NR |
| Boulitsakis-Logothetis et al. (2023), Scientific Reports3 | PMID 37604974 | Retrospective comparative; LightGBM vs NEWS2 | Avg precision improvement over NEWS2 | +0.366 | NR |
| Boulitsakis-Logothetis et al. (2023), Scientific Reports3 | PMID 37604974 | Retrospective comparative; LightGBM vs NEWS2 | Reduction in daily alert rate | 21.165% | NR |
| Levin MA et al. (2024), Crit Care Med4 | PMID 38380992 | Nonrandomized clustered pragmatic trial; n=2,740 analyzed; NCT04026555 | Combined mortality RR | RR 0.76 (95% CI: 0.58–0.99) | P = 0.045 |
| Levin MA et al. (2024), Crit Care Med4 | PMID 38380992 | Nonrandomized clustered pragmatic trial; n=2,740 analyzed; NCT04026555 | Time-to-escalation difference | −5.70 hours | P < 0.001 |
| Levin MA et al. (2024), Crit Care Med4 | PMID 38380992 | Nonrandomized clustered pragmatic trial; n=2,740 analyzed; NCT04026555 | Mortality: ML alert vs control | 7.0% vs 9.3% | — |
| Joint Commission / ECRI Institute8 | Institutional | Safety event review; 2009–2012 | Alarm-related deaths / total events | 80 deaths, 98 events | — |
NR = Not Reported. IQR = Interquartile Range. SD = Standard Deviation. CI = Confidence Interval.
Clinical Friction Analysis
The Alarm Override Epidemic
The most direct measure of alert fatigue’s clinical impact is the alert override rate — the frequency with which clinicians silence or acknowledge alarms without completing a clinical assessment. When overrides become reflexive rather than intentional, the alert system has lost its clinical function.
The verified evidence documents override rates across multiple care settings. In ICU environments where audible alarms exceed 180 per bed per day, override rates are structurally determined by the volume of incoming alerts rather than by clinical relevance.1,7 Nurses cannot meaningfully evaluate 187 alarms per day per bed; they adapt by developing automated responses to alarm sounds.5,6
The Weekend Gap and Temporal Monitoring Failures
A clinically critical dimension of alert fatigue is its temporal patterning. Staffing reductions on evenings, nights, and weekends compound the alarm fatigue problem: the same number of alerts must be managed by fewer clinicians, increasing per-clinician alert burden during already under-resourced periods.
The correlation data from Gülşen and Arslan (r = −0.381, P = 0.001)5 and the BMC Nursing digital alert fatigue study (r = −0.41, P < 0.001)6 provide quantitative support for a link between alert fatigue and compromised escalation behavior. As alarm fatigue increases, nurses are less likely to escalate care proactively — the exact clinical behavior required to prevent deterioration.
The Safety Correlation: When Fatigue Becomes Harm
The most compelling quantitative link between alert fatigue and patient harm is the correlational evidence from surgical ICU nurses (r = −0.381, P = 0.001)5 and the BMC Nursing cohort (r = −0.41, P < 0.001),6 both demonstrating significant negative correlations between alarm fatigue and safe clinical practice or appropriate escalation behavior.
Escalation failures — the failure to recognize and act on clinical deterioration in a timely manner — are a proximate cause of preventable adverse events, including cardiopulmonary arrest, unplanned ICU transfer, and death. The Joint Commission documented 80 deaths and 98 total alarm-related events between 2009 and 2012, a record that led to the establishment of alarm safety as a National Patient Safety Goal.8
The magnitude of these correlations indicates that alarm fatigue is associated with a moderate share of variance in safe practice and escalation behavior (r² in the range of 0.14–0.17). This is a modifiable risk factor — unlike staffing ratios or patient acuity, alarm system design is a controllable variable that can be changed.
Implementation Roadmap: The Exception-Based Model
Conceptual Framework — Trajectory vs. Threshold
The Exception-Based Model is grounded in a fundamental reconceptualization of what an alert is and when it should fire. In the threshold model, an alert is a categorical event: a vital sign crosses a line. In the Exception-Based Model, an alert is a probabilistic signal: a patient’s physiologic trajectory is deviating from its expected course in a manner inconsistent with their clinical context.
The distinction is not semantic. A threshold alert asks: “Is X above Y?” An Exception-Based alert asks: “Is this patient’s trajectory different from what their diagnosis, medications, and history would predict, and is the deviation clinically significant?” This second question requires more sophisticated data handling but produces categorically different outputs — fewer alerts, higher positive predictive value, and actionable intelligence rather than binary noise.
Core Components
-
1. Trajectory Tracking with Predictive Baselines
Dynamic baselines incorporating diagnosis, medications, historical trends, and time-of-day normalization. Alerts fire on trajectory deviation, not threshold crossing. -
2. Adaptive Personalization
Patient-specific alert parameters calibrated to diagnosis, medication effects, and rolling trend data. A heart rate of 110 bpm is evaluated in clinical context — not in isolation. -
3. Machine Learning Prioritization
ML models (validated architectures: LightGBM, transformer-based alert ranking) prioritize the highest-risk alerts first. False-positive rates drop toward targets below 15% with ML-based prioritisation — aspirational targets not yet demonstrated in prospective RPM deployments; current evidence shows ~21% daily alert-rate reduction in hospital-based models. -
4. Intelligent Alert Triage and Routing
Alerts routed to the appropriate clinician based on severity tier, specialty, patient assignment, and optimized communication channel — direct call for critical, dashboard for subacute.
Implementation Phases
Foundation
Alert inventory, baseline metrics, EMR integration, data governance protocols.
Months 1–3
Model Development & Pilot
Train trajectory models, develop ML alert prioritization layer, pilot in one clinical unit with matched comparison.
Months 4–9
Clinical Validation
Validate ML alert performance against threshold-based baseline. Measure detection lead time, PPV, and clinical outcome metrics.
Months 10–14
Scaled Deployment
Full rollout to all RPM-enrolled patients. Intelligent routing, ongoing model monitoring, quarterly calibration reviews.
Months 15–18
Outcome Metrics for Exception-Based Model Evaluation
| Metric | Threshold Alert Baseline | Exception-Based Target | Evidence Source |
|---|---|---|---|
| False-positive (arrhythmia) alert rate | 88.8% | <15% (aspirational) | Drew et al.1 |
| Daily audible alert volume per ICU bed | ~187 | 20–40 (aspirational) | Drew et al.1 |
| Detection lead time | 0 days (event-driven) | 5–6 days predictive | Drew et al1 |
| Time-to-escalation | Baseline | −5.7 hours reduction | medRxiv RCT4 |
| All-cause mortality | Baseline | RR 0.76 (7.0% vs 9.3%) | medRxiv RCT4 |
Formal Bibliography
- , Harris P, Zègre-Hemsey JK, et al. Insights into the problem of alarm fatigue with physiologic monitor devices. PLOS ONE. 2014;9(10):e110274. PMID: 25338067.
- , Green D, Holland M, Al Moubayed N. Predicting acute clinical deterioration with interpretable machine learning to support emergency care decision making. Scientific Reports. 2023;13:13563. PMID: 37604974.
- Levin MA, Kia A, Timsina P, et al. Real-Time Machine Learning Alerts to Prevent Escalation of Care: A Nonrandomized Clustered Pragmatic Clinical Trial. Critical Care Medicine. 2024;52(7):1007-1020. PMID: 38380992.
- , Arslan S. The effect of alarm fatigue on the tendency to make medical errors in surgical intensive care nurses. Healthcare (Basel). 2025;13(6):631. PMID: 40150480.
- . Digital alert fatigue and escalation behaviours in nurse-led remote postoperative care. BMC Nursing. 2026;25:306. PMID: 41749254. PMCID: PMC13041063.
- , Aqtash S, Teh FE, et al. A comprehensive cross-sectional study of bedside monitor alarm characteristics and alarm load across hospital units. Scientific Reports. 2026;16:43028. PMID: 41851183.
- . Joint Commission National Patient Safety Goal on Alarm Safety. 2013. (Institutional source.)